Su questa foto
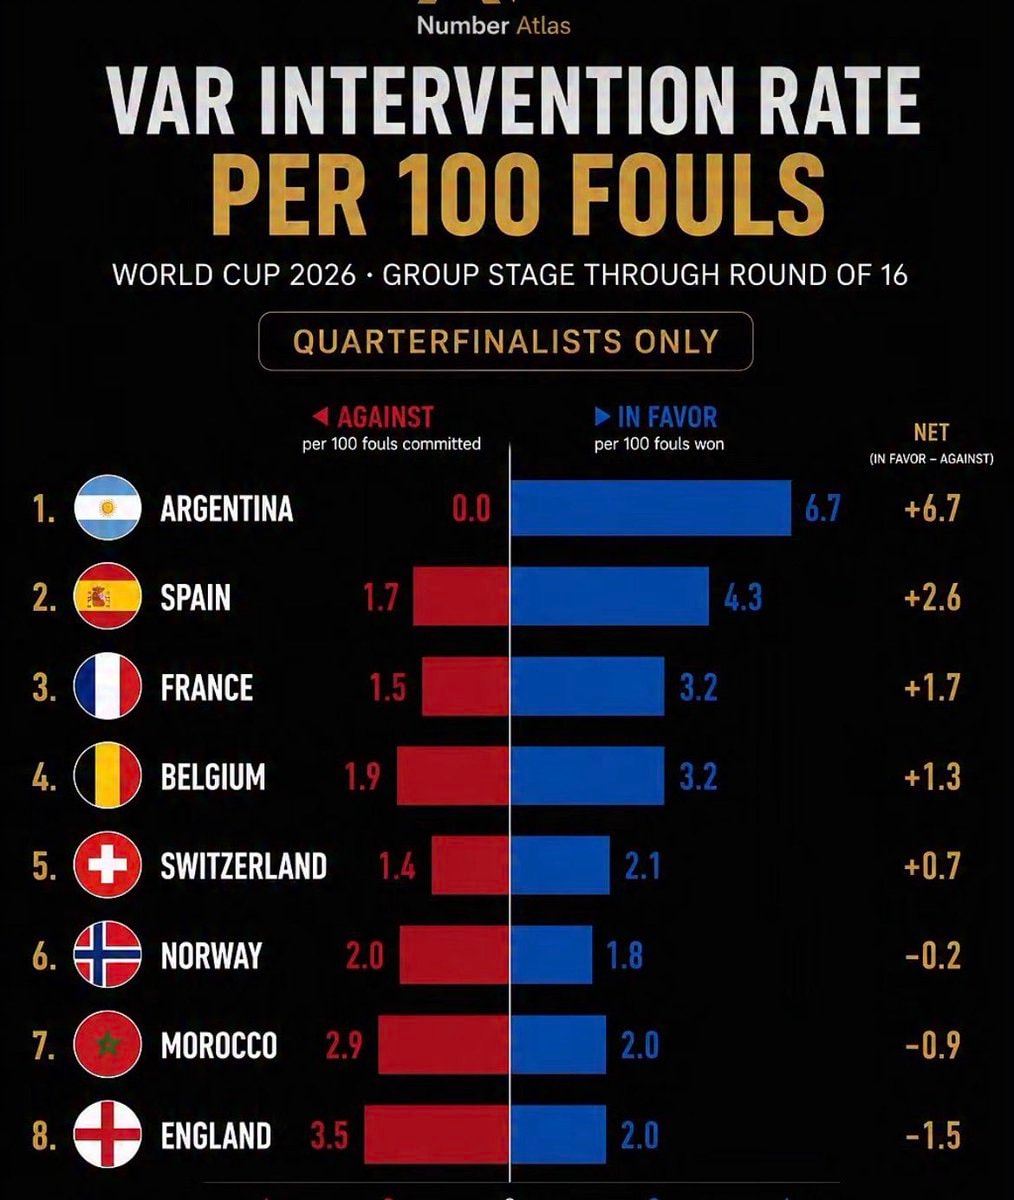
This is an infographic displaying VAR intervention rates per 100 fouls for quarterfinalists in the World Cup 2026 group stage through the round of 16. The data is presented in a bar chart format, comparing interventions against and in favor of teams, along with a net score. The aesthetic is clean and data-driven, with a dark background and bold text. Notable elements include the flags of the represented countries and the clear numerical data. The on-screen text reads "Number Atlas", "VAR INTERVENTION RATE PER 100 FOULS", "WORLD CUP 2026 · GROUP STAGE THROUGH ROUND OF 16", and "QUARTERFINALISTS ONLY".