iFANN
    Cerca su iFANN...
    Accedi
    Home
    Notizie
    Video
    Foto
    GIF
    Esplora
    Sondaggi
    Premi
    iFAMOUS
    Wiki
    Anime
    Stanze
    Notifiche
    Messaggi
    Segnalibri
    Profilo
    WikiPremiiFAMOUSClassificheSettoriRicompense CreatorRicompense UtenteTerminiPrivacyLinee guida della communityRimozione / DMCAAiutoSviluppatori

    © 2026 iFANN

    Home
    Cerca
    Messaggi
    Avvisi
    Profilo
    Foto
    Savage Updates
    Savage Updates@savageupdates2mo
    💭Climate💭Info/Editorials💭Science
    Fastest sinking coastal cities ranking

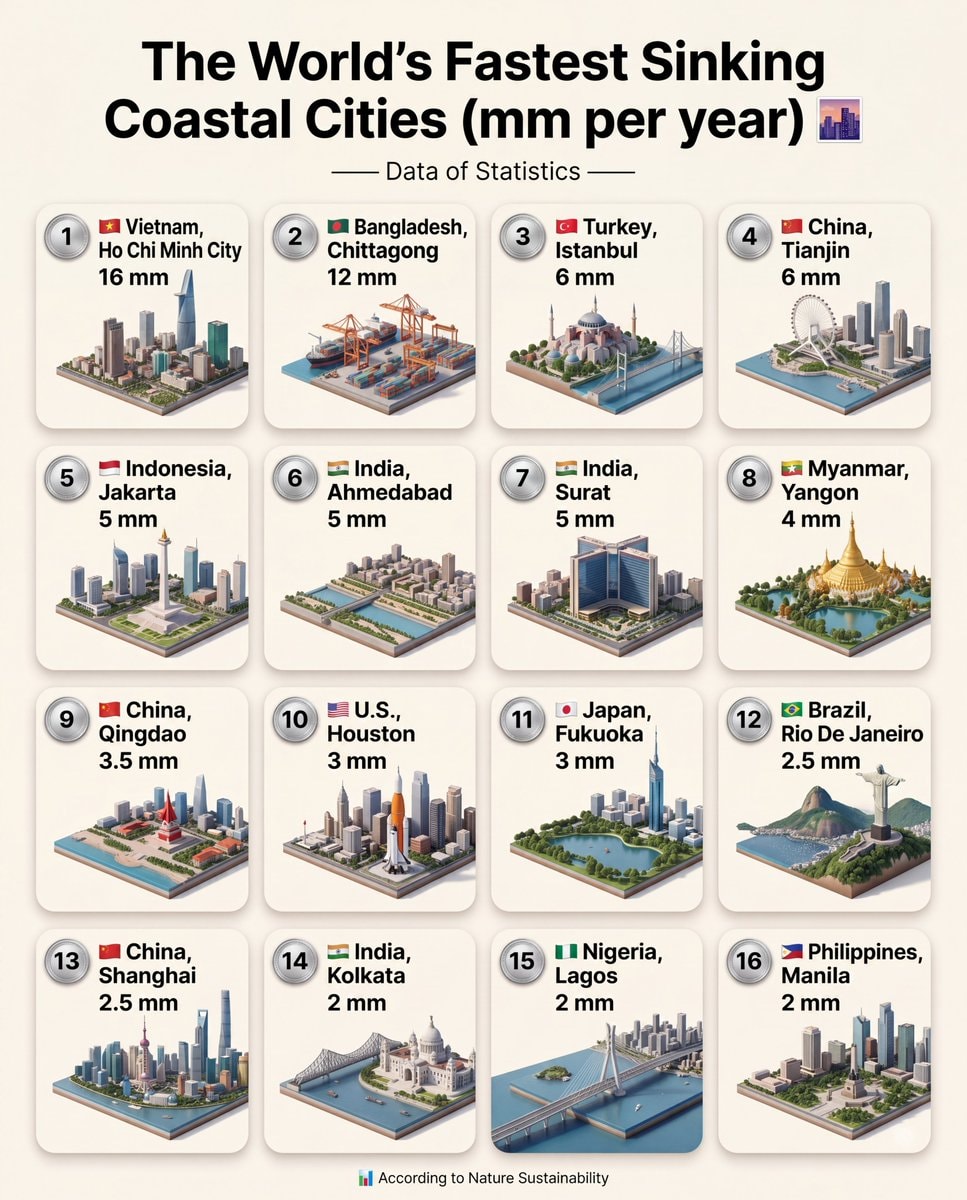
    @savageupdatesA fresh ranking from Nature Sustainability breaks down the fastest sinking coastal cities on the planet, measured in millimeters per year. Ho Chi Minh City leads the pack at 16 mm, and Chittagong is next at 12. Istanbul and Tianjin both hit 6, while Jakarta, Ahmedabad, and Surat each sit at 5. Yangon comes in at 4, Qingdao at 3.5, and Houston and Fukuoka at 3. Rio de Janeiro and Shanghai both register 2.5. Finally, Kolkata, Lagos, and Manila all sink at 2 mm per year.

    Vedi post originale


    Fastest sinking coastal cities ranking

    Foto di @savageupdates· Aug 12, 2026· Climate

    Su questa foto

    The image is an infographic detailing the world's fastest sinking coastal cities. It displays 16 different cities, each with a number, country flag, city name, and the rate at which it is sinking in millimeters per year. The style is clean and informative, with isometric illustrations of each city's skyline or key landmarks. A notable detail is the inclusion of specific landmarks like the Hagia Sophia in Istanbul and the Christ the Redeemer statue in Rio de Janeiro. The bottom of the infographic has the text "According to Nature Sustainability".

    Vedi tutte le foto di Climate

    ?

    Ancora nessun commento. Sii il primo!

    Altre foto di Climate

    Vedi tutte le foto di Climate
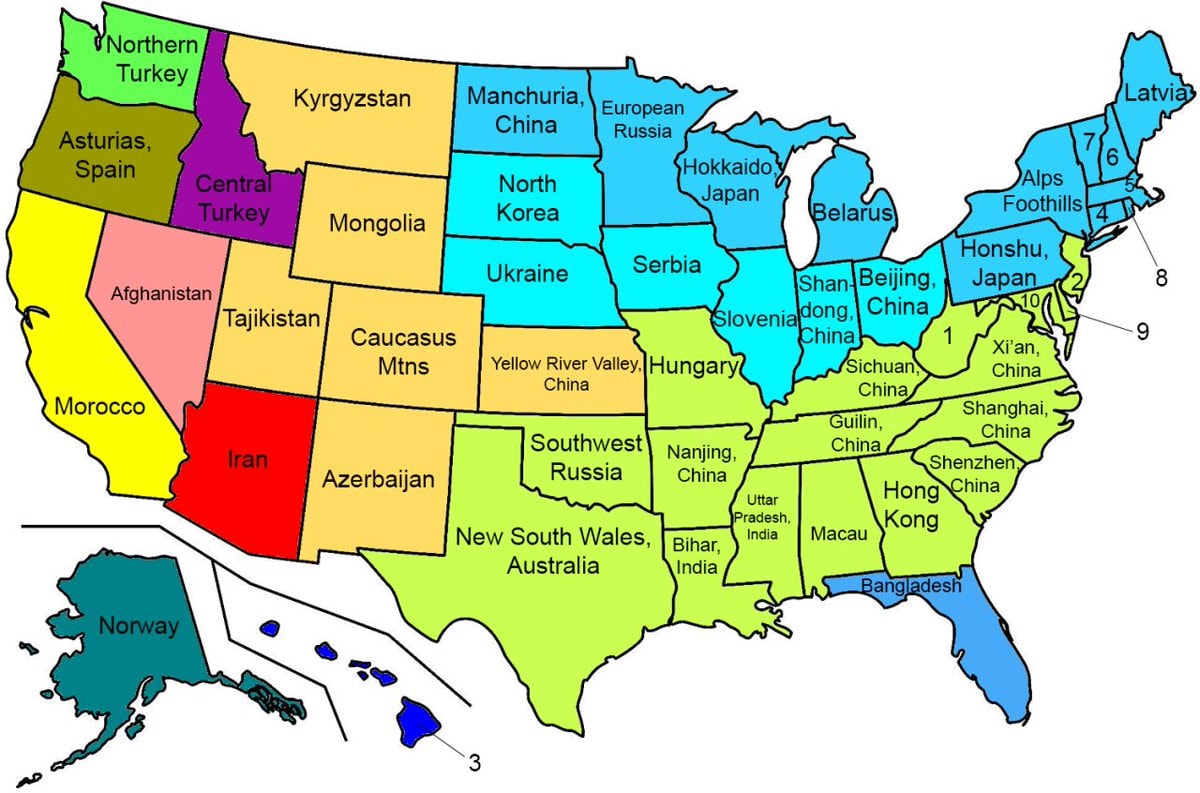
    Solar-panel fencing concept for farmsSolar-panel fencing concept for farmsWealth gap and climate impact2Wealth gap and climate impactUS states with similar climates worldwideUS states with similar climates worldwideUS climate match mapUS climate match mapEarth from space view2Earth from space viewUN warning on developing nations poverty risk2UN warning on developing nations poverty riskPakistan solar panel boom2Pakistan solar panel boomEraring Power Station Australia2Eraring Power Station AustraliaAmazon deforestation record low Brazil2Amazon deforestation record low BrazilGlobal chilli pepper production rankings 2024Global chilli pepper production rankings 2024Europe vs United States sunshine hoursEurope vs United States sunshine hoursArctic permafrost methane release2Arctic permafrost methane releaseIndia $19.4 billion renewable plan2India $19.4 billion renewable planJapan 34-day rain record2Japan 34-day rain recordAustralia climate zones vs the worldAustralia climate zones vs the worldNepal PM on climate crisis2Nepal PM on climate crisisRenewable energy capacity must triple by 20302Renewable energy capacity must triple by 2030Europe climate study 20252Europe climate study 2025
    Foto
    Savage Updates
    Savage Updates@savageupdates2mo
    💭Climate💭Info/Editorials💭Science
    Fastest sinking coastal cities ranking

    @savageupdatesA fresh ranking from Nature Sustainability breaks down the fastest sinking coastal cities on the planet, measured in millimeters per year. Ho Chi Minh City leads the pack at 16 mm, and Chittagong is next at 12. Istanbul and Tianjin both hit 6, while Jakarta, Ahmedabad, and Surat each sit at 5. Yangon comes in at 4, Qingdao at 3.5, and Houston and Fukuoka at 3. Rio de Janeiro and Shanghai both register 2.5. Finally, Kolkata, Lagos, and Manila all sink at 2 mm per year.

    Vedi post originale
    Fastest sinking coastal cities ranking

    Foto di @savageupdates· Aug 12, 2026· Climate

    Su questa foto

    The image is an infographic detailing the world's fastest sinking coastal cities. It displays 16 different cities, each with a number, country flag, city name, and the rate at which it is sinking in millimeters per year. The style is clean and informative, with isometric illustrations of each city's skyline or key landmarks. A notable detail is the inclusion of specific landmarks like the Hagia Sophia in Istanbul and the Christ the Redeemer statue in Rio de Janeiro. The bottom of the infographic has the text "According to Nature Sustainability".

    Vedi tutte le foto di Climate

    ?

    Ancora nessun commento. Sii il primo!

    Altre foto di Climate

    Vedi tutte le foto di Climate
    Solar-panel fencing concept for farmsSolar-panel fencing concept for farmsWealth gap and climate impact2Wealth gap and climate impactUS states with similar climates worldwideUS states with similar climates worldwideUS climate match mapUS climate match mapEarth from space view2Earth from space viewUN warning on developing nations poverty risk2UN warning on developing nations poverty riskPakistan solar panel boom2Pakistan solar panel boomEraring Power Station Australia2Eraring Power Station AustraliaAmazon deforestation record low Brazil2Amazon deforestation record low BrazilGlobal chilli pepper production rankings 2024Global chilli pepper production rankings 2024Europe vs United States sunshine hoursEurope vs United States sunshine hoursArctic permafrost methane release2Arctic permafrost methane releaseIndia $19.4 billion renewable plan2India $19.4 billion renewable planJapan 34-day rain record2Japan 34-day rain recordAustralia climate zones vs the worldAustralia climate zones vs the worldNepal PM on climate crisis2Nepal PM on climate crisisRenewable energy capacity must triple by 20302Renewable energy capacity must triple by 2030Europe climate study 20252Europe climate study 2025