Su questa foto
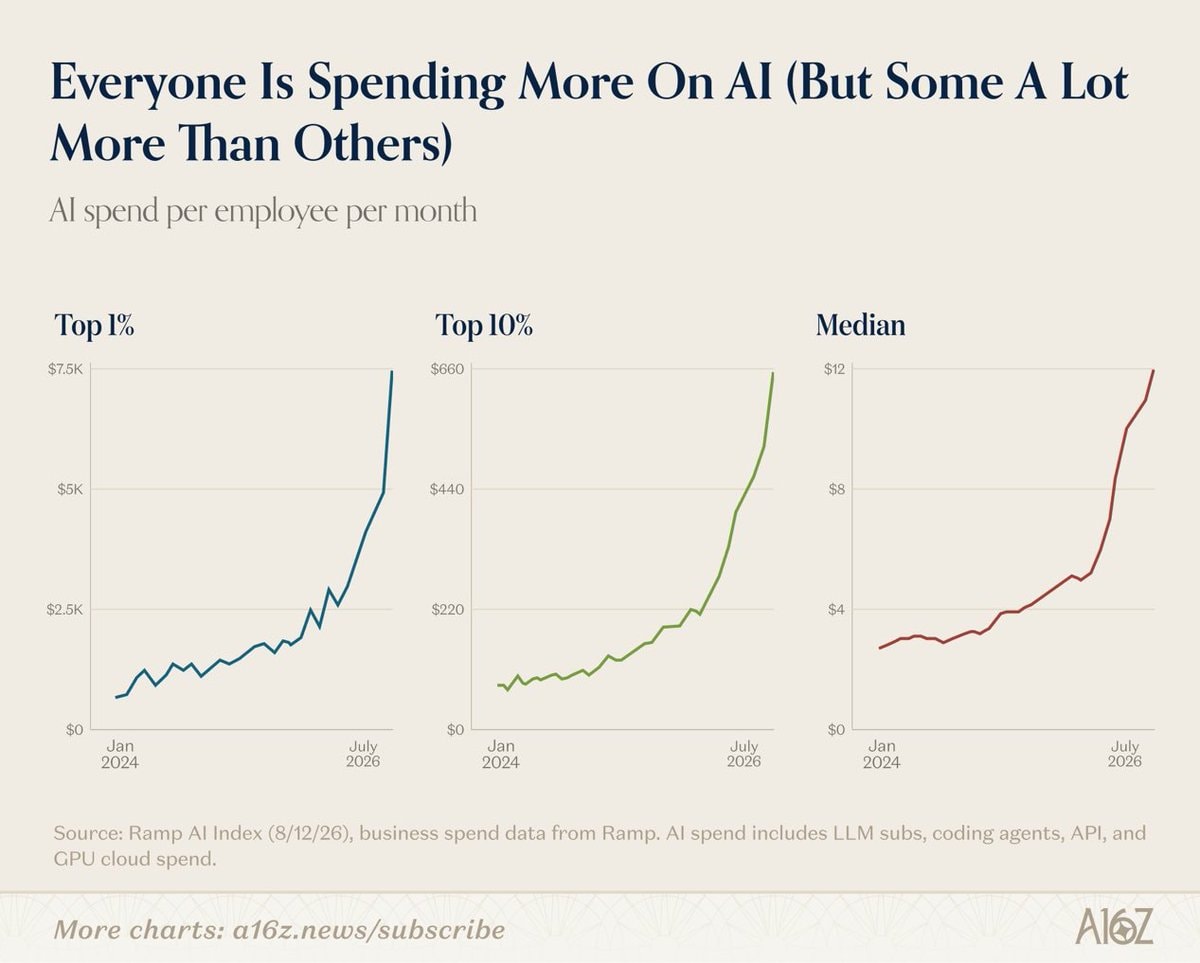
The image is a data visualization showing AI spend per employee per month. It features three line graphs comparing the "Top 1%", "Top 10%", and "Median" spending categories from January 2024 to July 2026. The graphs show a significant upward trend, especially for the top spending groups. The overall mood is informative and analytical, with a clean, modern aesthetic. A notable detail is the stark contrast in spending growth between the top percentiles and the median. ON-SCREEN TEXT: Everyone Is Spending More On AI (But Some A Lot More Than Others) AI spend per employee per month Top 1% Top 10% Median $7.5k $660 $12 $5k $440 $8 $2.5k $220 $4 $0 $0 $0 Jan 2024 July 2026 Jan 2024 July 20