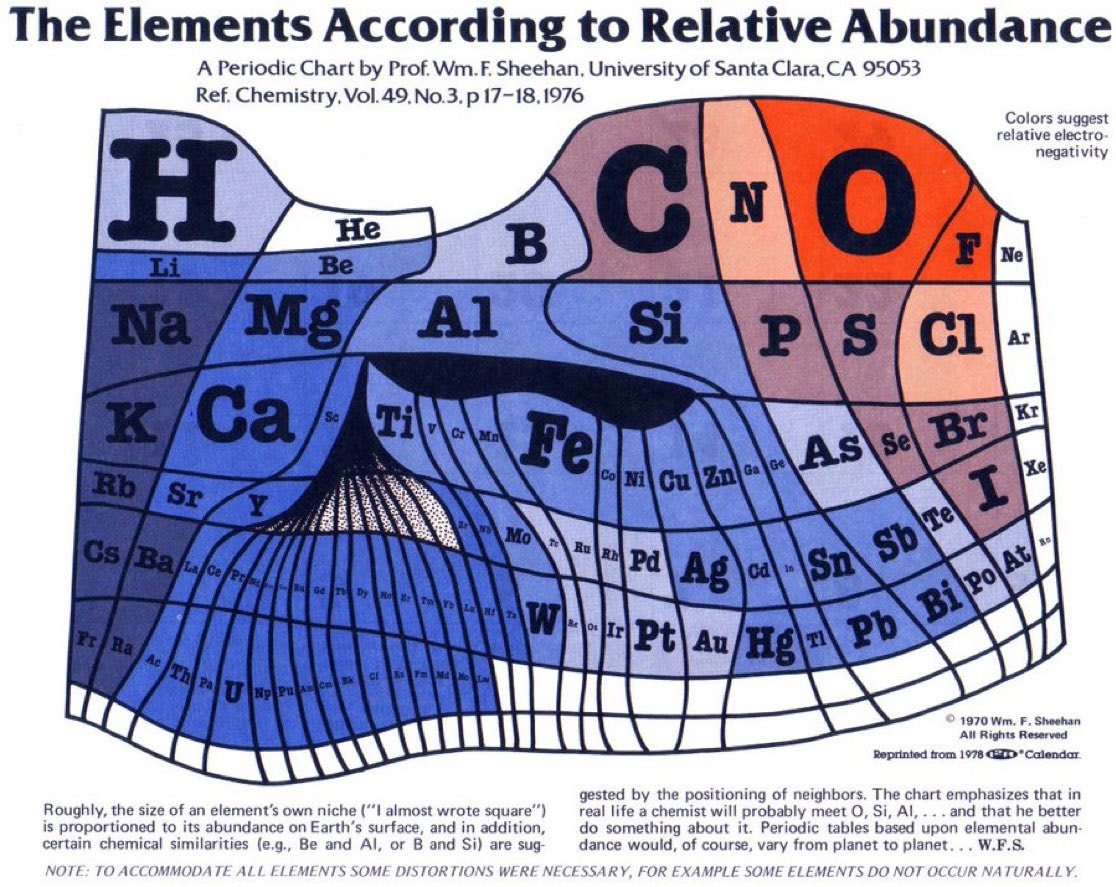
@sur_27The periodic table of elements scaled to show the actual abundance of the elements on Earth by Prof. Wm. F. Sheehan in 1976. #Science
Vedi post originale@sur_27The periodic table of elements scaled to show the actual abundance of the elements on Earth by Prof. Wm. F. Sheehan in 1976. #Science
Vedi post originaleFoto di @sur_27· Aug 31, 2026· Science
The image is a diagram of the elements according to relative abundance. It's a stylized periodic table with elements represented by their symbols within irregularly shaped cells. The cells are colored in shades of blue, orange, and brown, with a note that colors suggest relative electronegativity. A notable visual element is a 3D-like representation of a landscape or structure in the lower-middle section of the chart, connecting various elements. The style is educational and infographic-like. ON-SCREEN TEXT: The Elements According to Relative Abundance A Periodic Chart by Prof. Wm. F. Sheehan, University of Santa Clara, CA 95053 Ref. Chemistry, Vol.49, No.3, p 17-18, 1976 Colors suggest relative electronegativity © 1970 Wm. F. Sheehan All Rights Reserved Reprinted from 1978 G&D Calendar. Roughly, the size of an element's own niche ("I almost wrote square") is proportioned
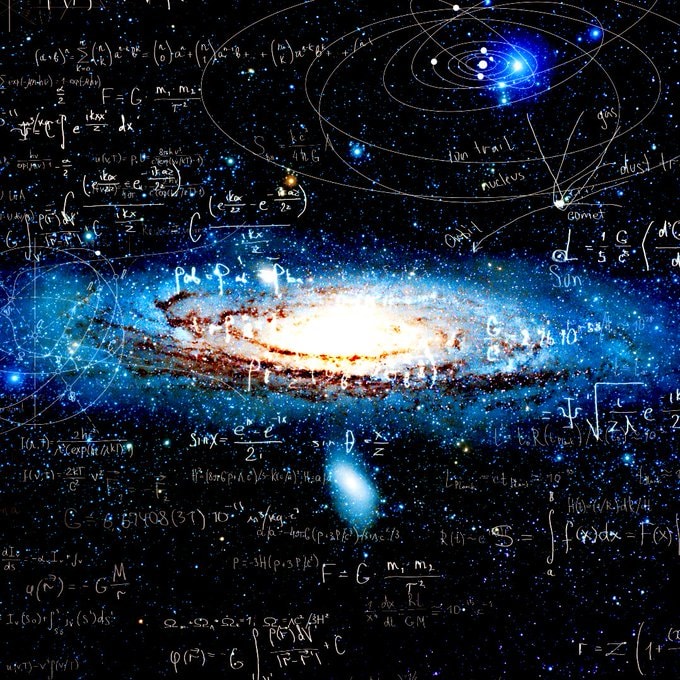 mathematics language vs tool
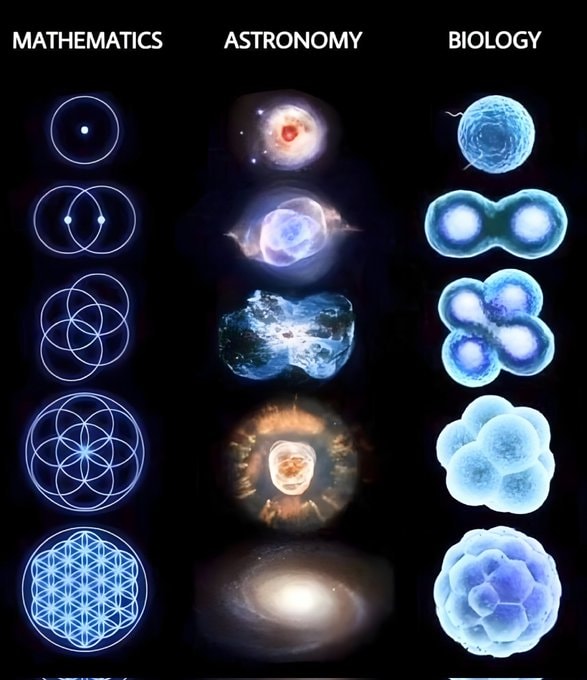 mathematics astronomy biology grid
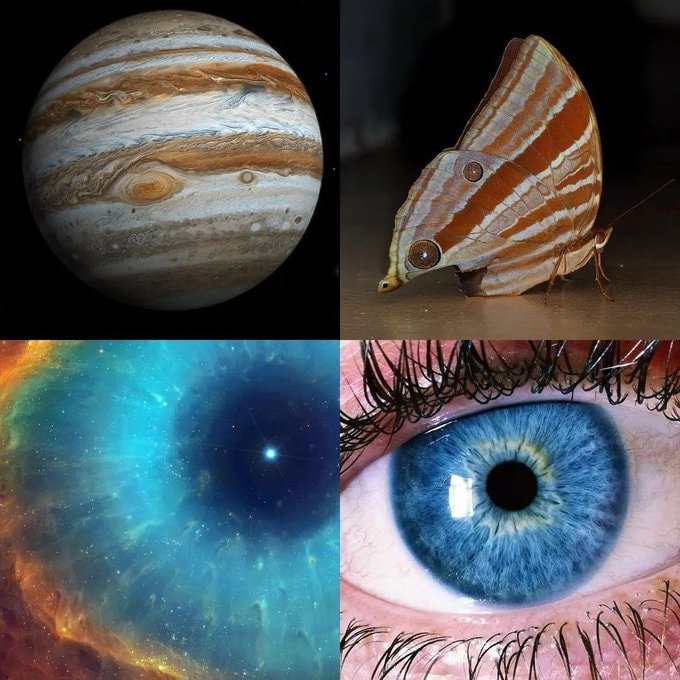 Carl Sagan star stuff quote
 bee collecting nectar
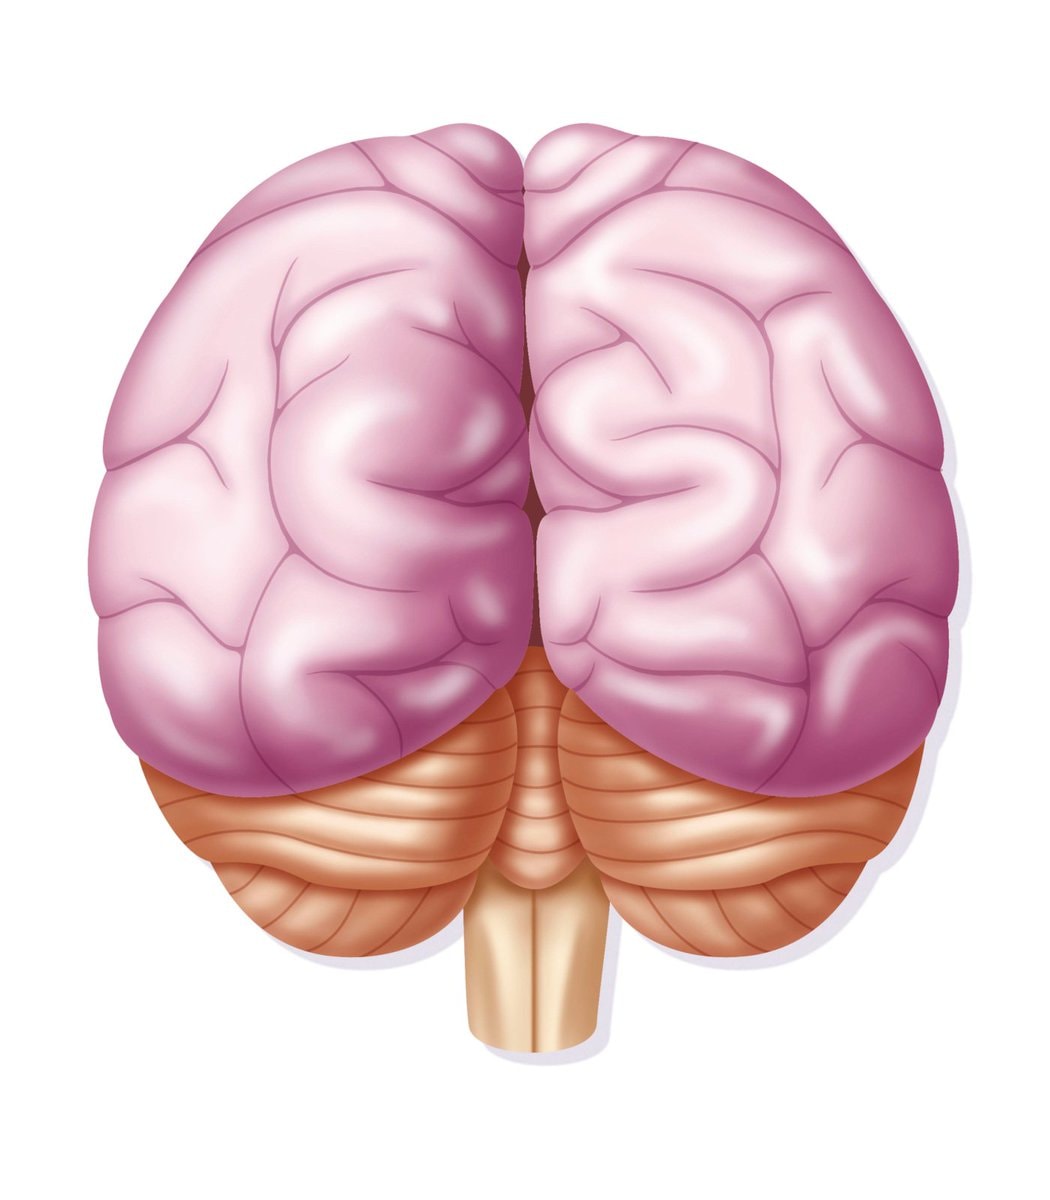 2Human brain anatomy illustration
 Michio Kaku on Einstein's Mind of God
 Terence Tao on his weaknesses
 Richard P. Feynman quote
 2Genetically engineered mice with human cells
 4obsessed with this face
 2Chilean tree daisy conservation effort
 2Octopus DNA editing
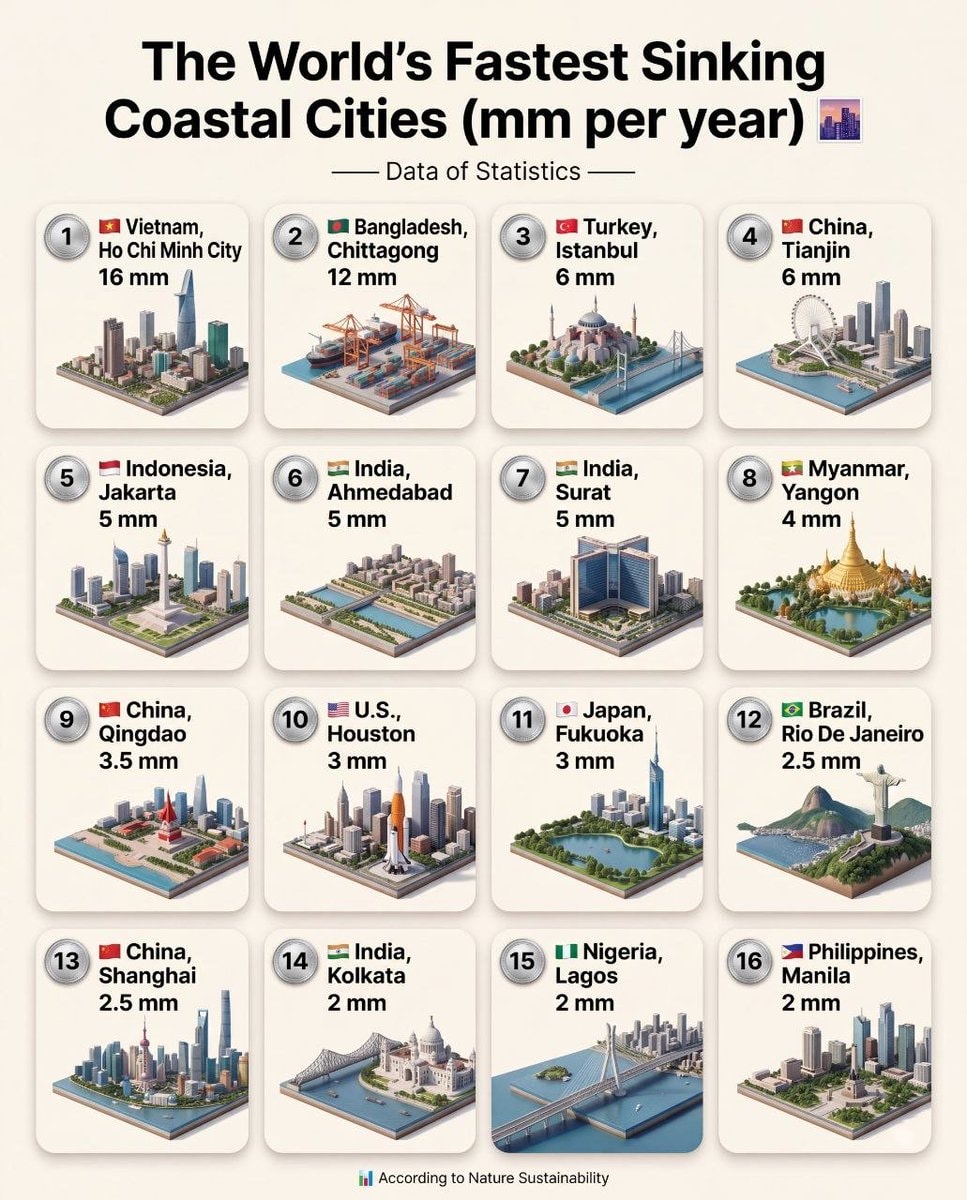 World's Fastest Sinking Coastal Cities
 Invisible architect universe theory
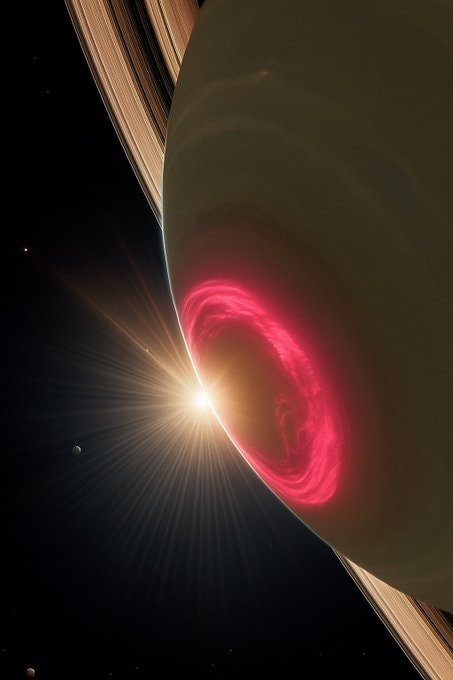 Aurora Borealis on Saturn
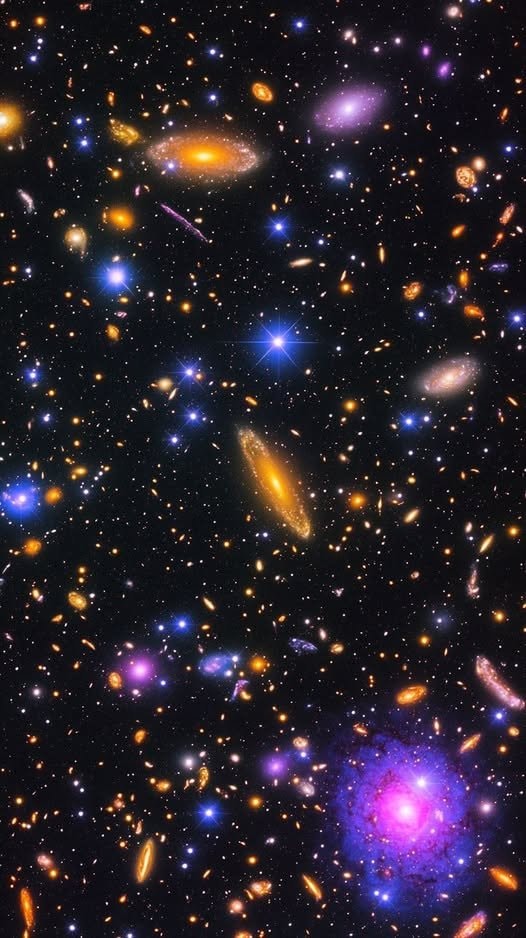 universe unreachable at light speed
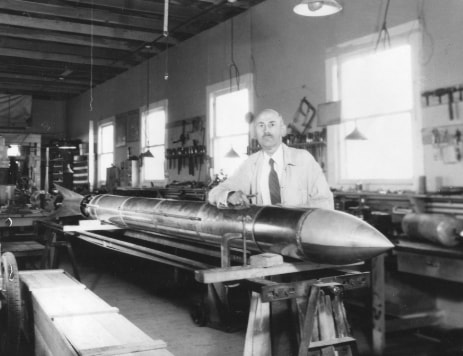 Robert H. Goddard rocket workshop
 human brain cosmos quantum scale
@sur_27The periodic table of elements scaled to show the actual abundance of the elements on Earth by Prof. Wm. F. Sheehan in 1976. #Science
Vedi post originaleFoto di @sur_27· Aug 31, 2026· Science
The image is a diagram of the elements according to relative abundance. It's a stylized periodic table with elements represented by their symbols within irregularly shaped cells. The cells are colored in shades of blue, orange, and brown, with a note that colors suggest relative electronegativity. A notable visual element is a 3D-like representation of a landscape or structure in the lower-middle section of the chart, connecting various elements. The style is educational and infographic-like. ON-SCREEN TEXT: The Elements According to Relative Abundance A Periodic Chart by Prof. Wm. F. Sheehan, University of Santa Clara, CA 95053 Ref. Chemistry, Vol.49, No.3, p 17-18, 1976 Colors suggest relative electronegativity © 1970 Wm. F. Sheehan All Rights Reserved Reprinted from 1978 G&D Calendar. Roughly, the size of an element's own niche ("I almost wrote square") is proportioned
Ancora nessun commento. Sii il primo!
mathematics language vs toolmathematics astronomy biology gridCarl Sagan star stuff quotebee collecting nectar2Human brain anatomy illustrationMichio Kaku on Einstein's Mind of GodTerence Tao on his weaknessesRichard P. Feynman quote2Genetically engineered mice with human cells4obsessed with this face2Chilean tree daisy conservation effort2Octopus DNA editingWorld's Fastest Sinking Coastal CitiesInvisible architect universe theoryAurora Borealis on Saturnuniverse unreachable at light speedRobert H. Goddard rocket workshophuman brain cosmos quantum scale
Ancora nessun commento. Sii il primo!