Su questa foto
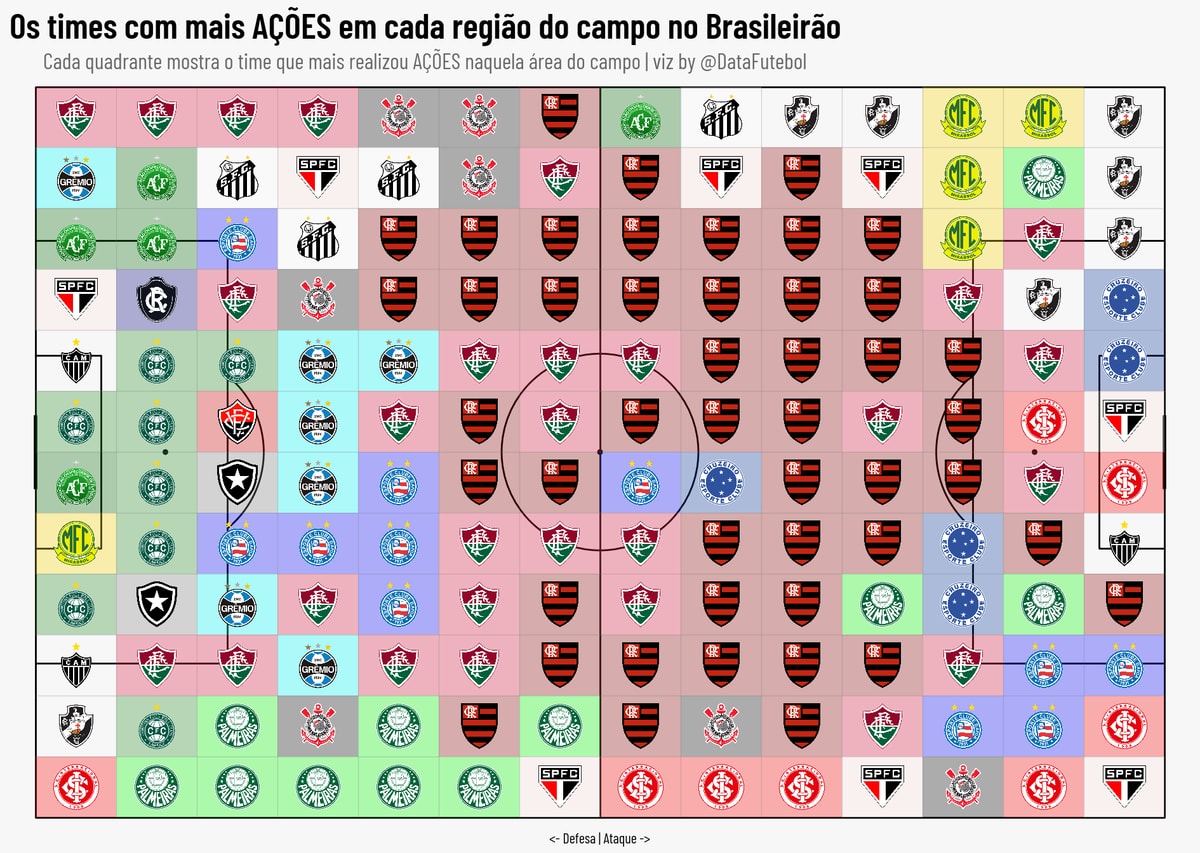
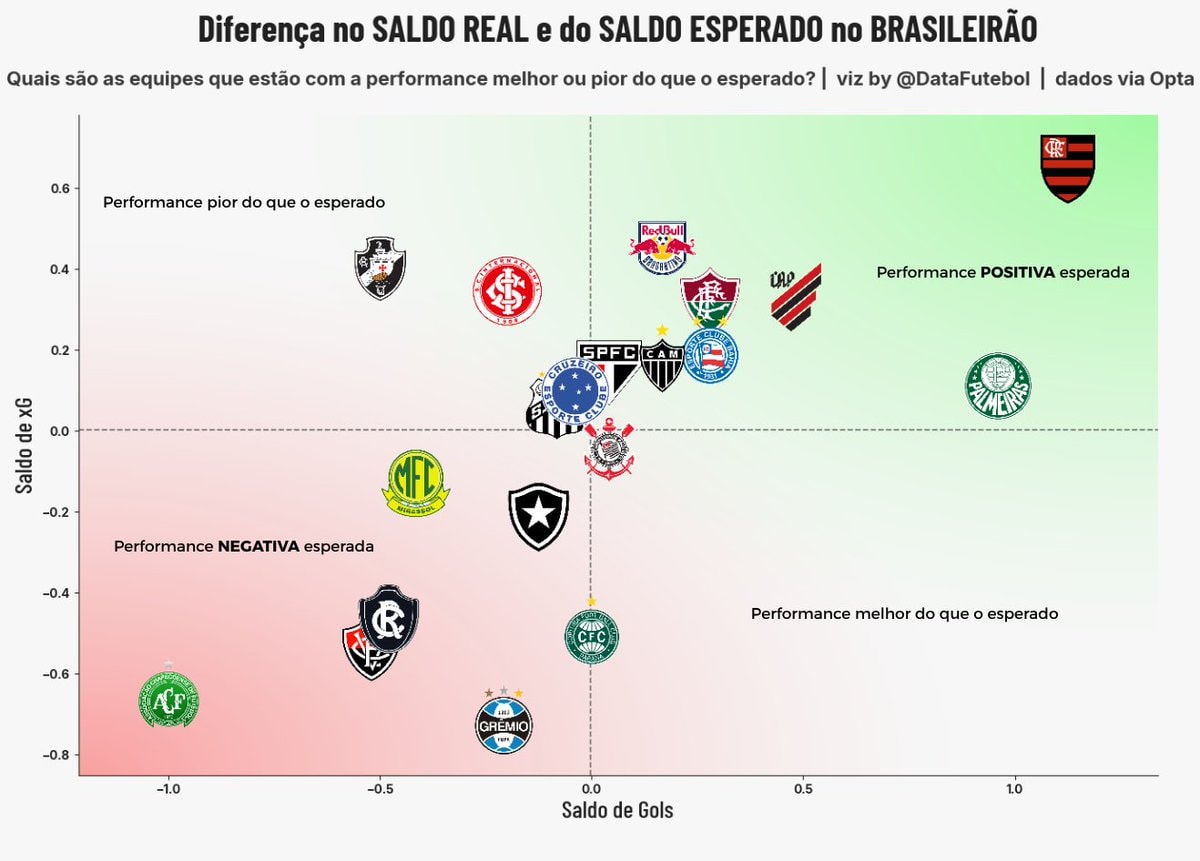
This is a data visualization of football team actions on the field. The image is a grid of squares, each containing a football club's logo. The squares are color-coded and arranged to represent different regions of a football pitch. The overall mood is informative and analytical, with a clean, graphic style. A notable detail is the circle drawn around a cluster of Flamengo logos, suggesting a focus on their activity. The on-screen text reads "Os times com mais AÇÕES em cada região do campo no Brasileiro" and "Cada quadrante mostra o time que mais realizou AÇÕES naquela área do campo | viz by @DataFutebol". At the bottom, it says "< Defesa | Ataque >".