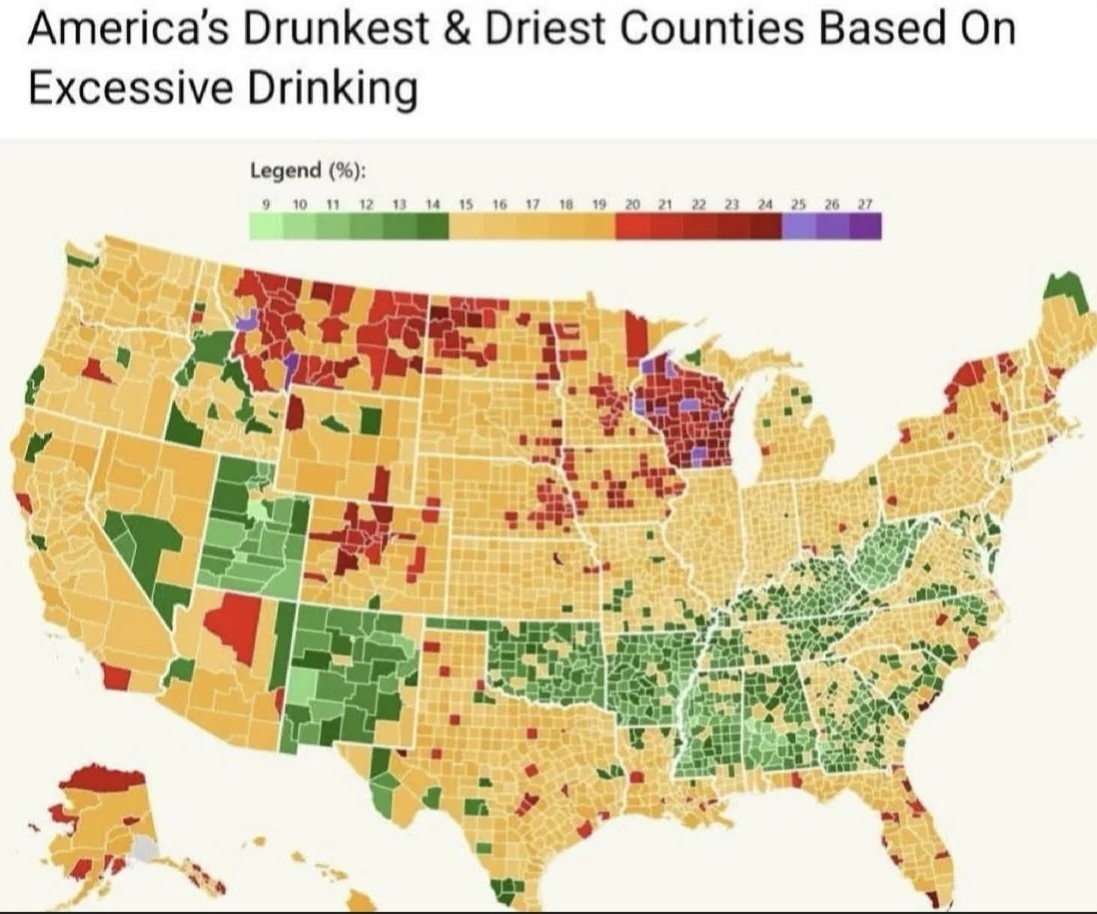
@krzysztof.wDoes this map match where you live and how much you drink? #UnitedStates
Vedi post originale@krzysztof.wDoes this map match where you live and how much you drink? #UnitedStates
Vedi post originaleFoto di @krzysztof.w· Nov 4, 2026· United States
America's Drunkest and Driest Counties Based On Excessive Drinking is displayed as a color-coded choropleth map of the United States. The map uses a gradient legend from light green at 9 percent through yellows oranges reds and ending in dark purple at 27 percent to show the percentage of excessive drinking by county. The visual style is a straightforward data visualization news graphic with a clean white background and a horizontal color scale bar at the top. Notable clusters of deep red appear across the upper Midwest especially Wisconsin and parts of the Mountain West while large contiguous green regions dominate the Southeast and Pacific Northwest. On-screen text includes the title at the top and the legend labeled Legend (%) with the exact numeric scale 9 10 11 12 13 14 15 16 17 18 19 20 21 22 23 24 25 26 27.
 V-shaped lights over England speculation
 Josh Law Coast Guard rescue
 Trump administration election monitoring team
 2US funding to Israel ending
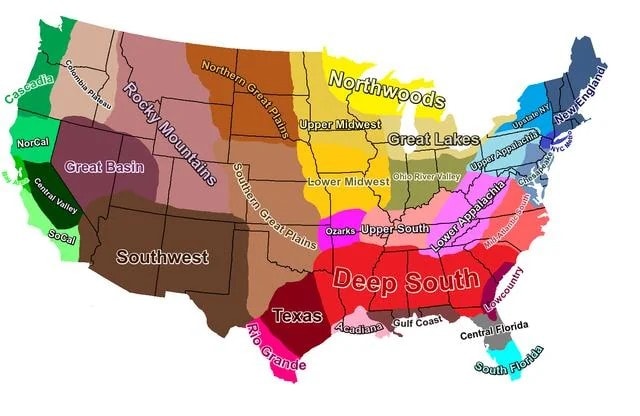 U.S. cultural regions map
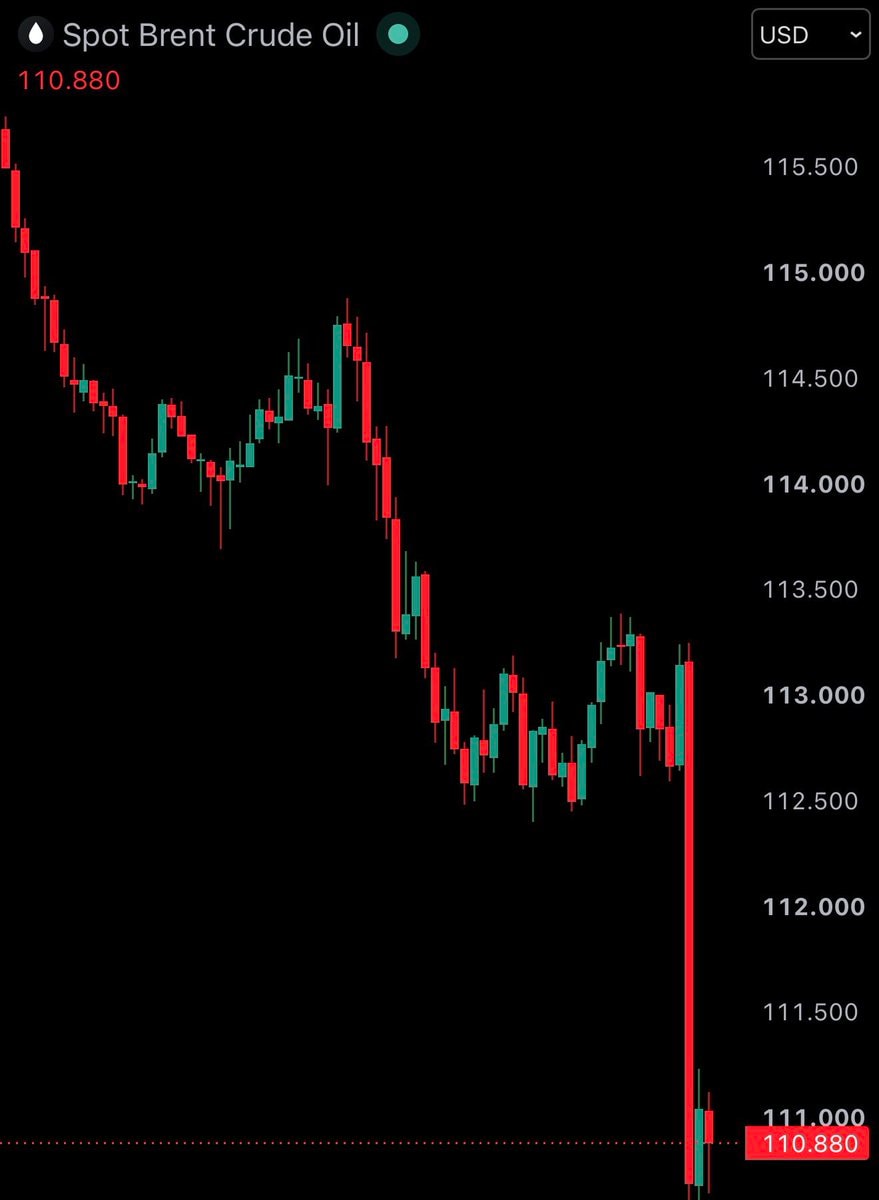 Brent Crude Oil price drop
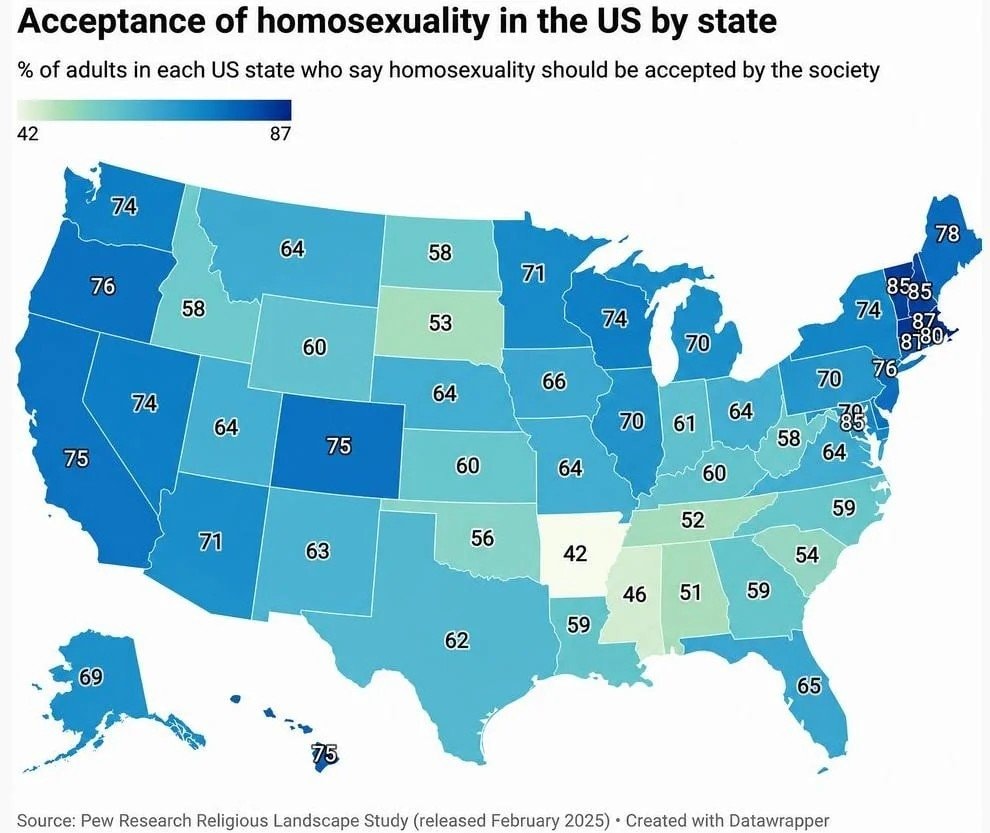 US homosexuality acceptance by state
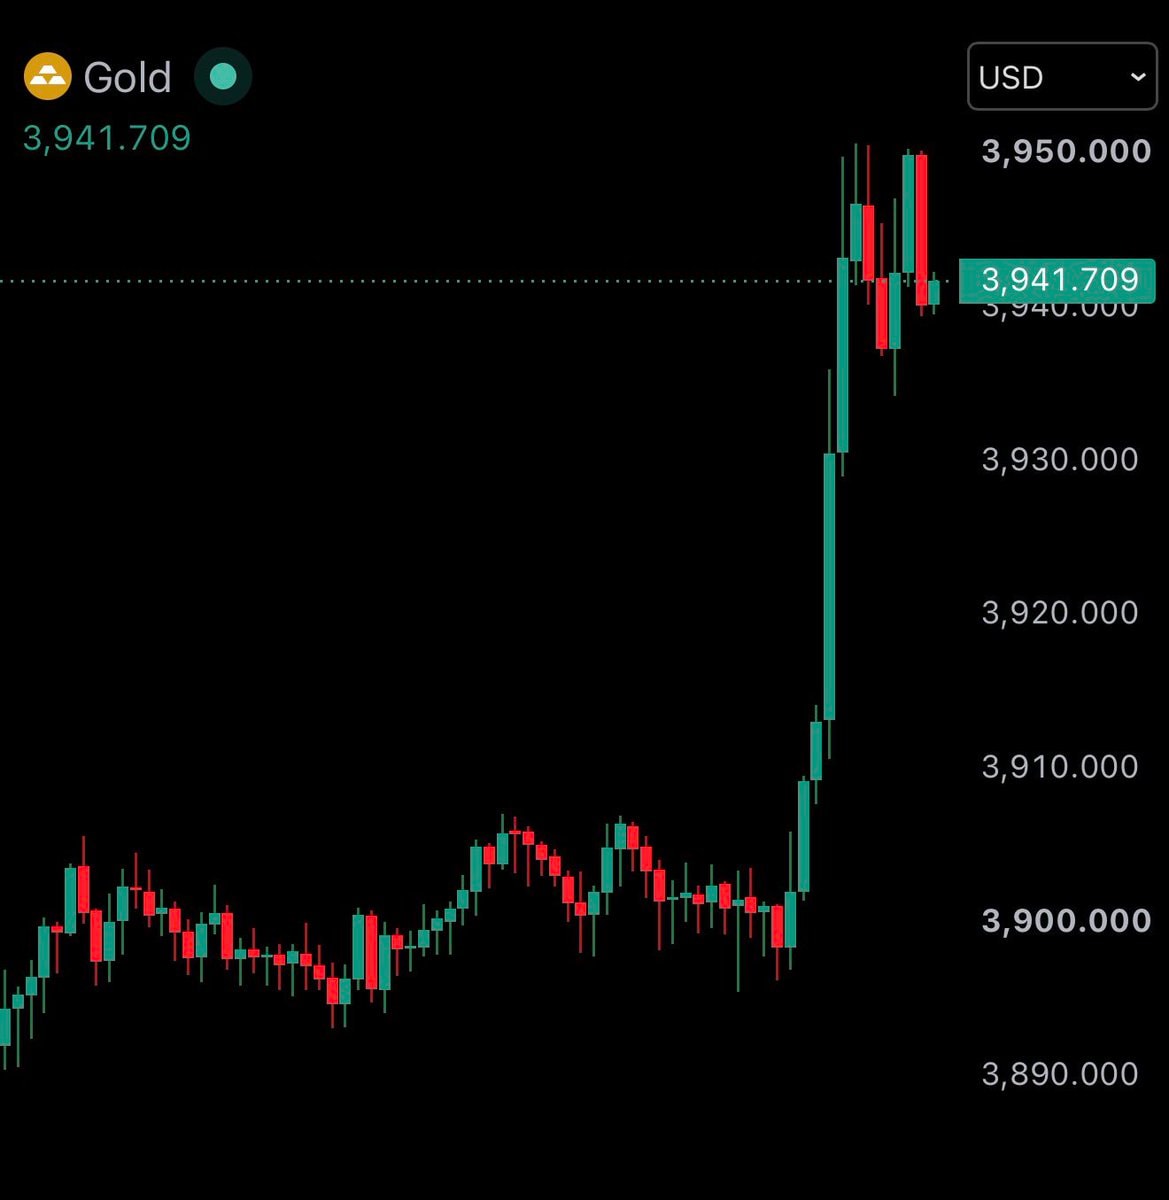 2Gold price chart rise
 Massachusetts marijuana repeal vote
 2Ye Reliant Stadium Halloween
 2China US Moon landing race
 mean travel time to work by u.s. state
 Hello everyone
@krzysztof.wDoes this map match where you live and how much you drink? #UnitedStates
Vedi post originaleFoto di @krzysztof.w· Nov 4, 2026· United States
America's Drunkest and Driest Counties Based On Excessive Drinking is displayed as a color-coded choropleth map of the United States. The map uses a gradient legend from light green at 9 percent through yellows oranges reds and ending in dark purple at 27 percent to show the percentage of excessive drinking by county. The visual style is a straightforward data visualization news graphic with a clean white background and a horizontal color scale bar at the top. Notable clusters of deep red appear across the upper Midwest especially Wisconsin and parts of the Mountain West while large contiguous green regions dominate the Southeast and Pacific Northwest. On-screen text includes the title at the top and the legend labeled Legend (%) with the exact numeric scale 9 10 11 12 13 14 15 16 17 18 19 20 21 22 23 24 25 26 27.
Ancora nessun commento. Sii il primo!
V-shaped lights over England speculationJosh Law Coast Guard rescueTrump administration election monitoring team2US funding to Israel endingU.S. cultural regions mapBrent Crude Oil price dropUS homosexuality acceptance by state2Gold price chart riseMassachusetts marijuana repeal vote2Ye Reliant Stadium Halloween2China US Moon landing racemean travel time to work by u.s. stateHello everyone
Ancora nessun commento. Sii il primo!