Su questa foto
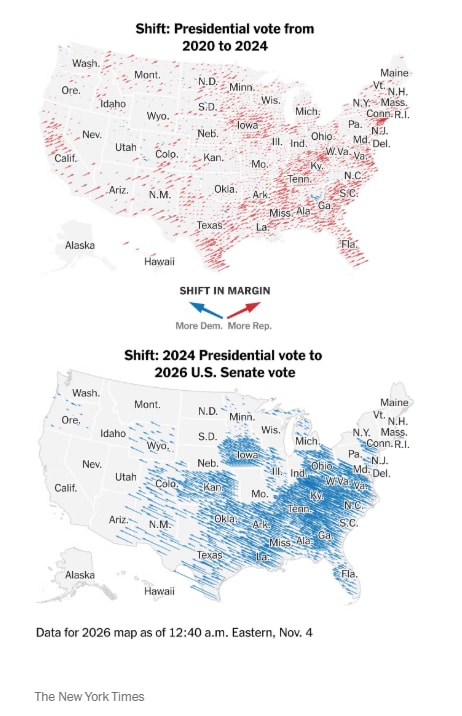
The image is a pair of data visualization maps from The New York Times showing U.S. electoral shifts. The top map displays the shift in presidential vote margin from 2020 to 2024 with red diagonal lines indicating movement toward Republicans across most states. The bottom map shows the shift from the 2024 presidential vote to the 2026 U.S. Senate vote with blue diagonal lines concentrated in the Midwest and South. On-screen text includes the titles “Shift: Presidential vote from 2020 to 2024” and “Shift: 2024 Presidential vote to 2026 U.S. Senate vote,” a legend labeled “SHIFT IN MARGIN” with blue and red arrows for “More Dem.” and “More Rep.,” and a footer noting “Data for 2026 map as of 12:40 a.m. Eastern, Nov. 4” plus the newspaper’s name. The clean, minimalist news-graphic style uses red and blue hatching over a white U.S. map with state abbreviations.