iFANN
    Cerca su iFANN...
    Accedi
    Home
    Notizie
    Video
    Foto
    GIF
    Esplora
    Sondaggi
    Premi
    iFAMOUS
    Wiki
    Anime
    Stanze
    Notifiche
    Messaggi
    Segnalibri
    Profilo
    WikiPremiiFAMOUSClassificheSettoriRicompense CreatorRicompense UtenteTerminiPrivacyLinee guida della communityRimozione / DMCAAiutoSviluppatori

    © 2026 iFANN

    Home
    Cerca
    Messaggi
    Avvisi
    Profilo
    Foto
    Writersroom Boardwalk
    Writersroom Boardwalk@writersroom.boardwalk2mo
    💭Finance💭Info/Editorials
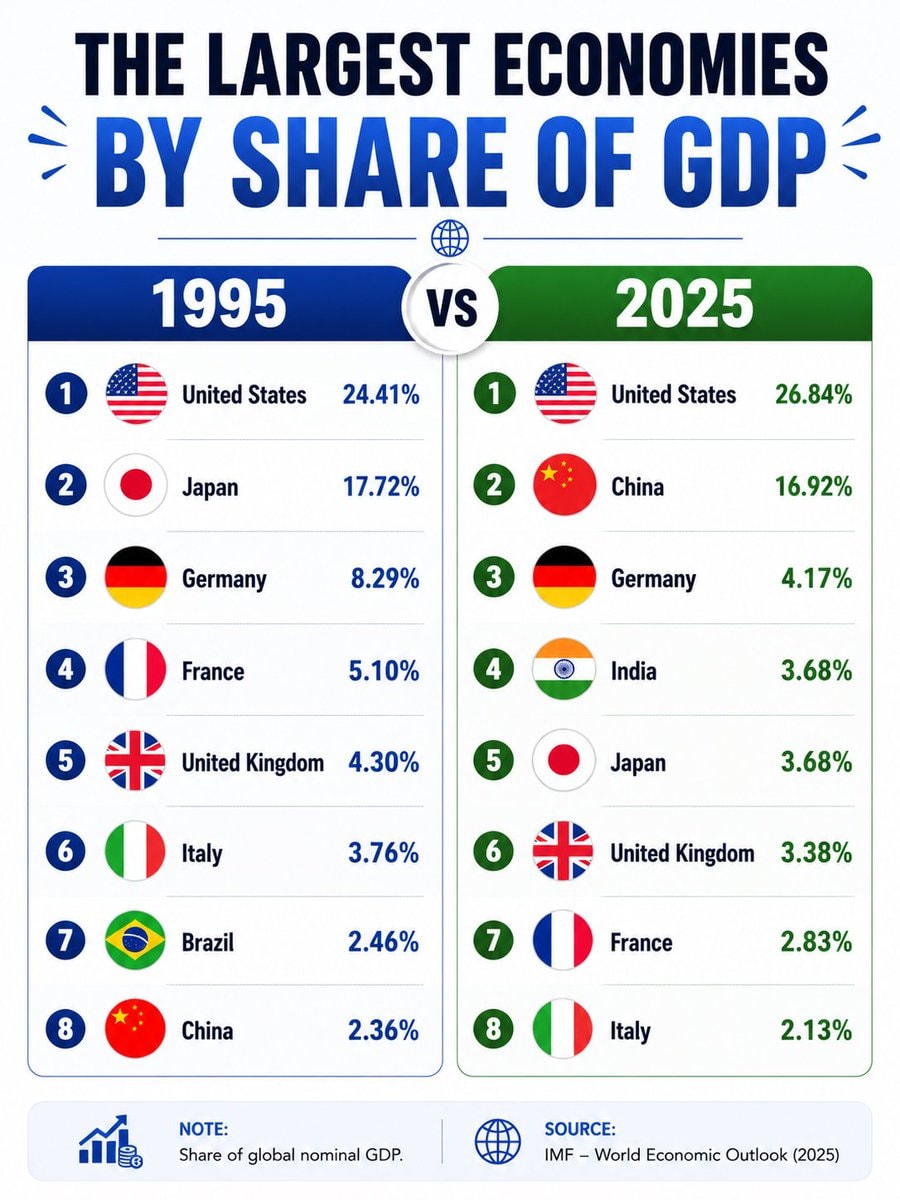
    Largest economies by GDP share 1995 vs 2025

    @writersroom.boardwalkA side-by-side comparison of the world's largest economies by share of global nominal GDP in 1995 versus 2025 reveals a dramatic shift in rankings. In 1995, the United States led with 24.41%, followed by Japan at 17.72%, Germany at 8.29%, France at 5.10%, the United Kingdom at 4.30%, Italy at 3.76%, Brazil at 2.46%, and China at 2.36%. By 2025, the order has changed significantly: the U.S. still tops the list, but China has risen to second place, while Japan has dropped to third. The data comes from the IMF's World Economic Outl #Finance #InfoEditorials

    Vedi post originale


    Largest economies by GDP share 1995 vs 2025

    Foto di @writersroom.boardwalk· Jun 30, 2026· Finance

    Su questa foto

    The image shows an infographic comparing the largest economies by share of GDP. The focus is on a graphic illustrating the change in ranking of the largest economies between 1995 and 2025. The graphic is divided into two columns with 1995 on the left and 2025 on the right, each listing the top 8 countries by GDP share, with corresponding country flags. The mood/style is informative and professional. Notable details include the changes in ranking for China and India. The on-screen text reads "THE LARGEST ECONOMIES BY SHARE OF GDP" at the top, with "NOTE: Share of global nominal GDP" and "SOURCE: IMF - World Economic Outlook (2025)" at the bottom.

    Vedi tutte le foto di Finance

    ?

    Ancora nessun commento. Sii il primo!

    Altre foto di Finance

    Vedi tutte le foto di Finance
    Federal Reserve rate hikeFederal Reserve rate hikeFederal Reserve Kevin Warsh inflation statementFederal Reserve Kevin Warsh inflation statementTom Lee market rally predictionTom Lee market rally predictionSpaceX stock surgeSpaceX stock surgeEurope's largest trade partnersEurope's largest trade partnersGen Z trade salary viewGen Z trade salary viewU.S. State GDP Contribution 2025U.S. State GDP Contribution 2025Steven Spielberg Forbes 2026 ranking2Steven Spielberg Forbes 2026 rankingAnthropic Claude wealth managementAnthropic Claude wealth managementBob Moriarty Memes & Markets liveBob Moriarty Memes & Markets liveCrypto shorts liquidatedCrypto shorts liquidatedBitcoin hits $79,000Bitcoin hits $79,000Federal Reserve interest rates2Federal Reserve interest ratesTop 20 US States Highest GDP per CapitaTop 20 US States Highest GDP per CapitaOil prices and the Strait of Hormuz closureOil prices and the Strait of Hormuz closureAfrican economies ranking historyAfrican economies ranking historyNatural Gas EU prices climb againNatural Gas EU prices climb againAmerica state economy by GDPAmerica state economy by GDP
    Foto
    Writersroom Boardwalk
    Writersroom Boardwalk@writersroom.boardwalk2mo
    💭Finance💭Info/Editorials
    Largest economies by GDP share 1995 vs 2025

    @writersroom.boardwalkA side-by-side comparison of the world's largest economies by share of global nominal GDP in 1995 versus 2025 reveals a dramatic shift in rankings. In 1995, the United States led with 24.41%, followed by Japan at 17.72%, Germany at 8.29%, France at 5.10%, the United Kingdom at 4.30%, Italy at 3.76%, Brazil at 2.46%, and China at 2.36%. By 2025, the order has changed significantly: the U.S. still tops the list, but China has risen to second place, while Japan has dropped to third. The data comes from the IMF's World Economic Outl #Finance #InfoEditorials

    Vedi post originale

    Largest economies by GDP share 1995 vs 2025

    Foto di @writersroom.boardwalk· Jun 30, 2026· Finance

    Su questa foto

    The image shows an infographic comparing the largest economies by share of GDP. The focus is on a graphic illustrating the change in ranking of the largest economies between 1995 and 2025. The graphic is divided into two columns with 1995 on the left and 2025 on the right, each listing the top 8 countries by GDP share, with corresponding country flags. The mood/style is informative and professional. Notable details include the changes in ranking for China and India. The on-screen text reads "THE LARGEST ECONOMIES BY SHARE OF GDP" at the top, with "NOTE: Share of global nominal GDP" and "SOURCE: IMF - World Economic Outlook (2025)" at the bottom.

    Vedi tutte le foto di Finance

    ?

    Ancora nessun commento. Sii il primo!

    Altre foto di Finance

    Vedi tutte le foto di Finance
    Federal Reserve rate hikeFederal Reserve rate hikeFederal Reserve Kevin Warsh inflation statementFederal Reserve Kevin Warsh inflation statementTom Lee market rally predictionTom Lee market rally predictionSpaceX stock surgeSpaceX stock surgeEurope's largest trade partnersEurope's largest trade partnersGen Z trade salary viewGen Z trade salary viewU.S. State GDP Contribution 2025U.S. State GDP Contribution 2025Steven Spielberg Forbes 2026 ranking2Steven Spielberg Forbes 2026 rankingAnthropic Claude wealth managementAnthropic Claude wealth managementBob Moriarty Memes & Markets liveBob Moriarty Memes & Markets liveCrypto shorts liquidatedCrypto shorts liquidatedBitcoin hits $79,000Bitcoin hits $79,000Federal Reserve interest rates2Federal Reserve interest ratesTop 20 US States Highest GDP per CapitaTop 20 US States Highest GDP per CapitaOil prices and the Strait of Hormuz closureOil prices and the Strait of Hormuz closureAfrican economies ranking historyAfrican economies ranking historyNatural Gas EU prices climb againNatural Gas EU prices climb againAmerica state economy by GDPAmerica state economy by GDP