
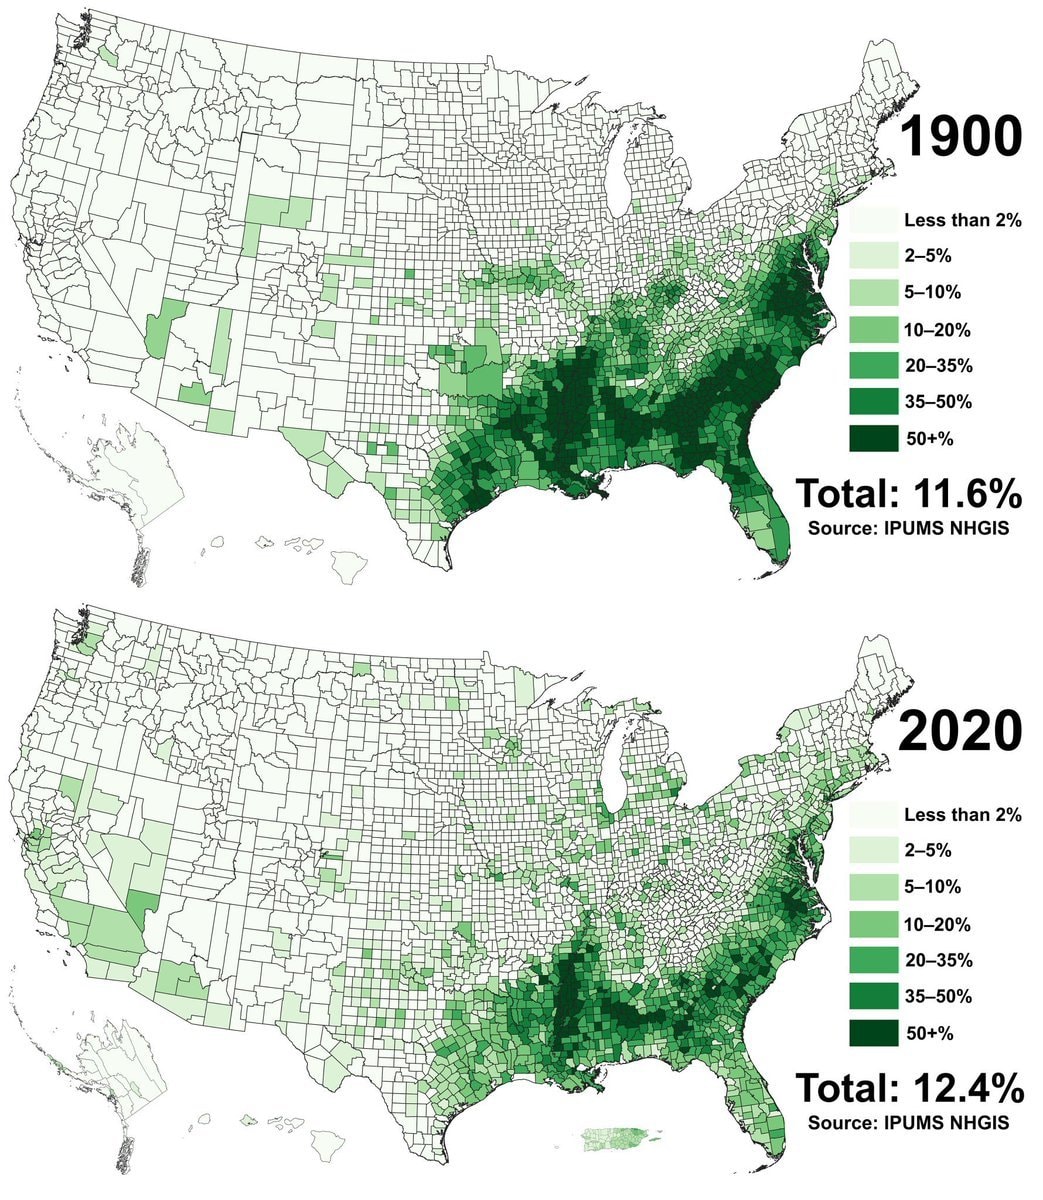
@scarlett_sComparing Black population share across U.S. county data from 1900 against 2020
Vedi post originale@scarlett_sComparing Black population share across U.S. county data from 1900 against 2020
Vedi post originaleFoto di @scarlett_s· Oct 11, 2026· United States
The image displays two maps of the United States, one labeled "1900" and the other "2020". Both maps use varying shades of green to represent percentages of something, with a legend indicating categories from "Less than 2%" to "50+%". The maps show a significant concentration of darker green in the southeastern US in both years, though the pattern appears to have shifted slightly westward and thinned out in some areas by 2020. The overall mood is informative and data-driven, resembling a chart or infographic. Notable details include the total percentages displayed below each map: "Total: 11.6%" for 1900 and "Total: 12.4%" for 2020, along with the source "IPUMS NHGIS".
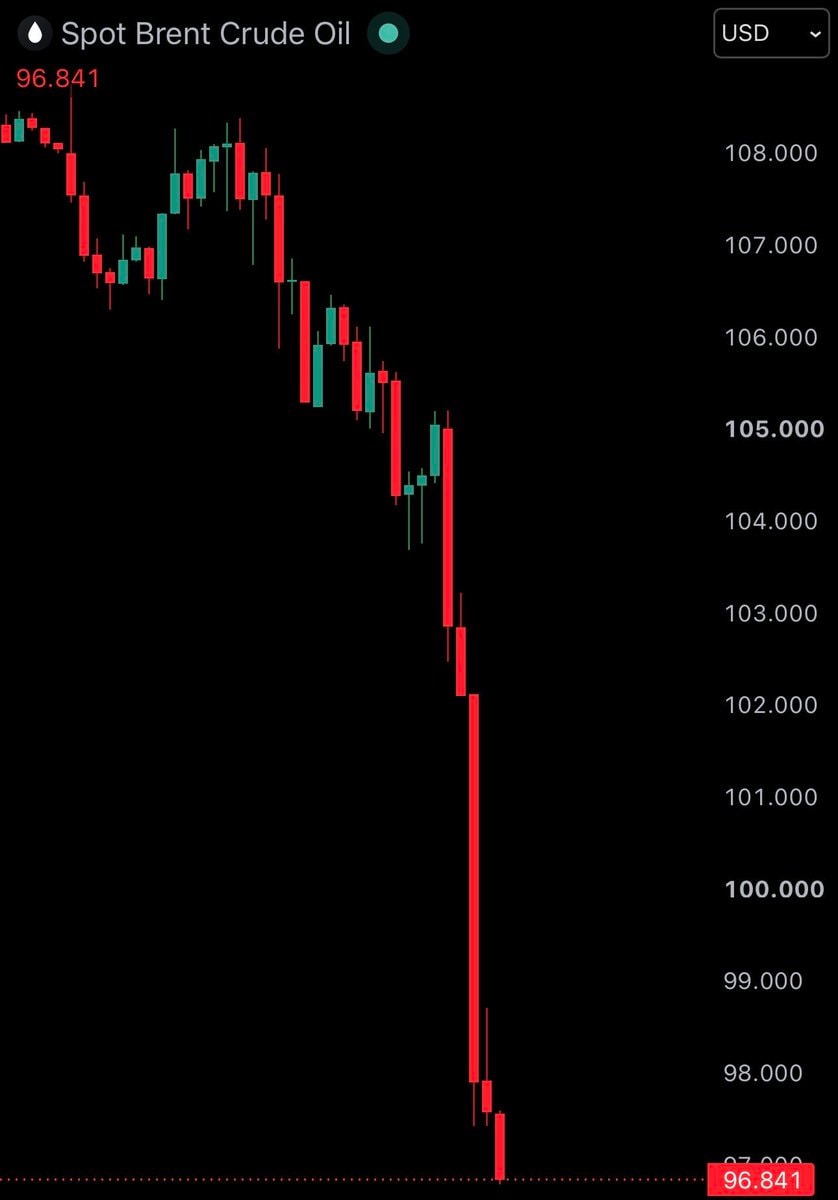 Brent crude oil chart
 US tech stocks surge after Democratic victory
 2Democrats win US House and Senate
 2Abdul El-Sayed Michigan election
 Tectone blue wave
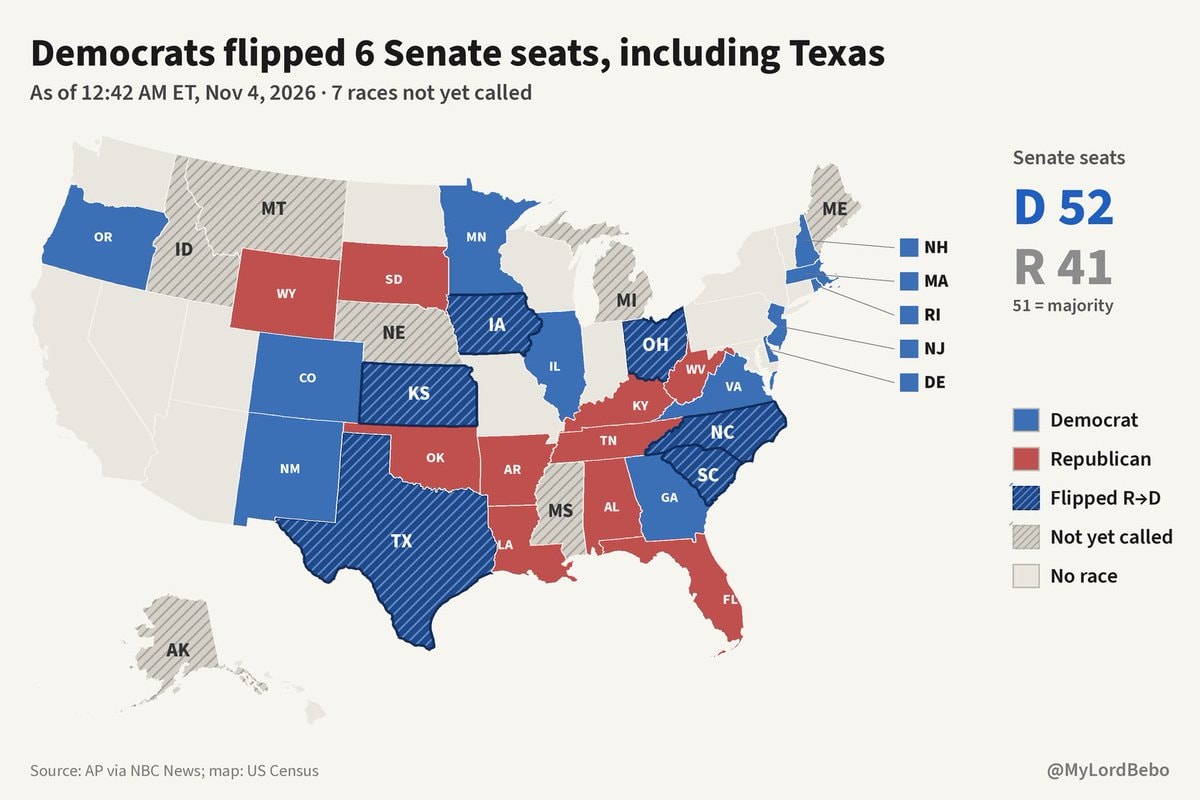 NBC News graphic shows Democrats flipping Texas
 2US stock market gain after Democratic victory
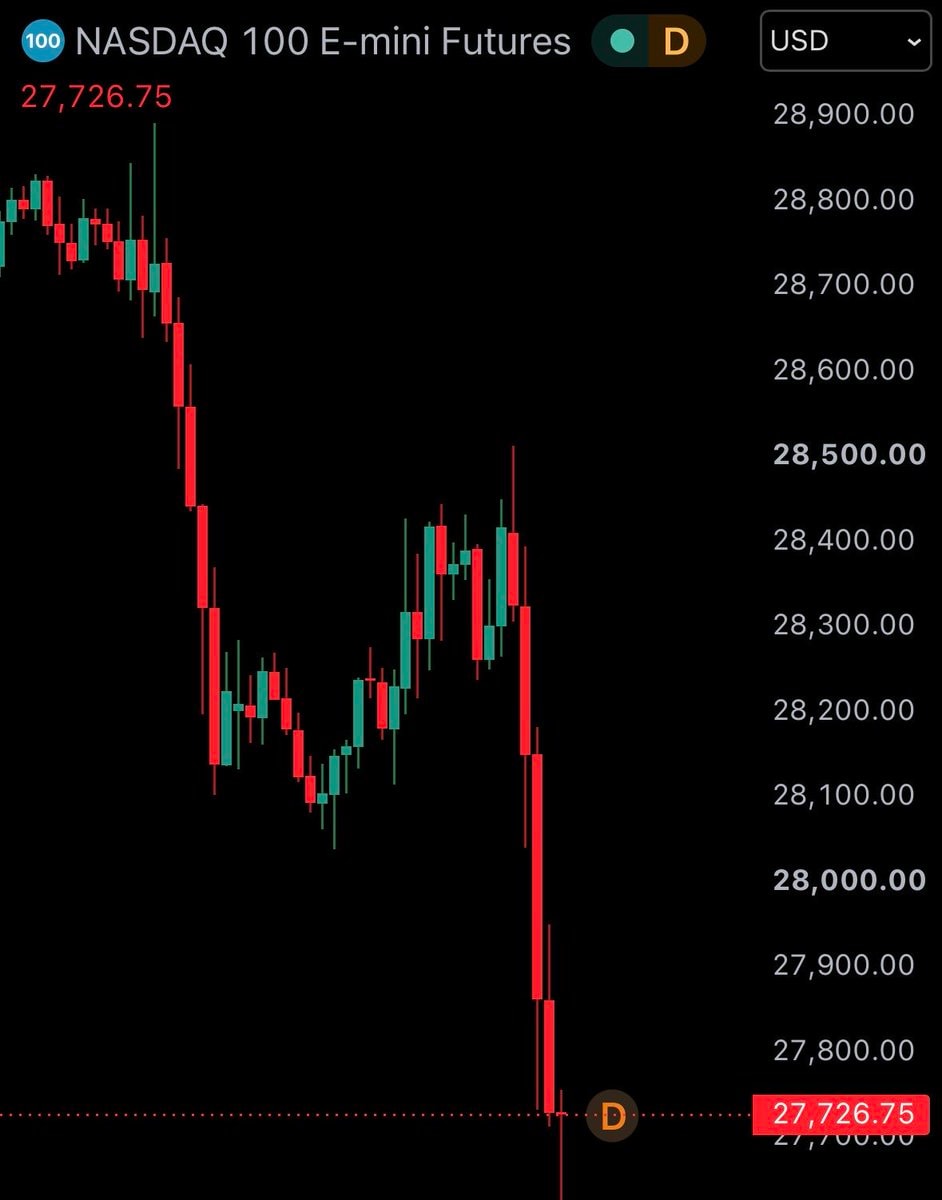 2US stock futures fall after election
 Democrats take House in US midterms
 Abdul El-Sayed first Muslim senator
 Columbia jacket I Voted sticker
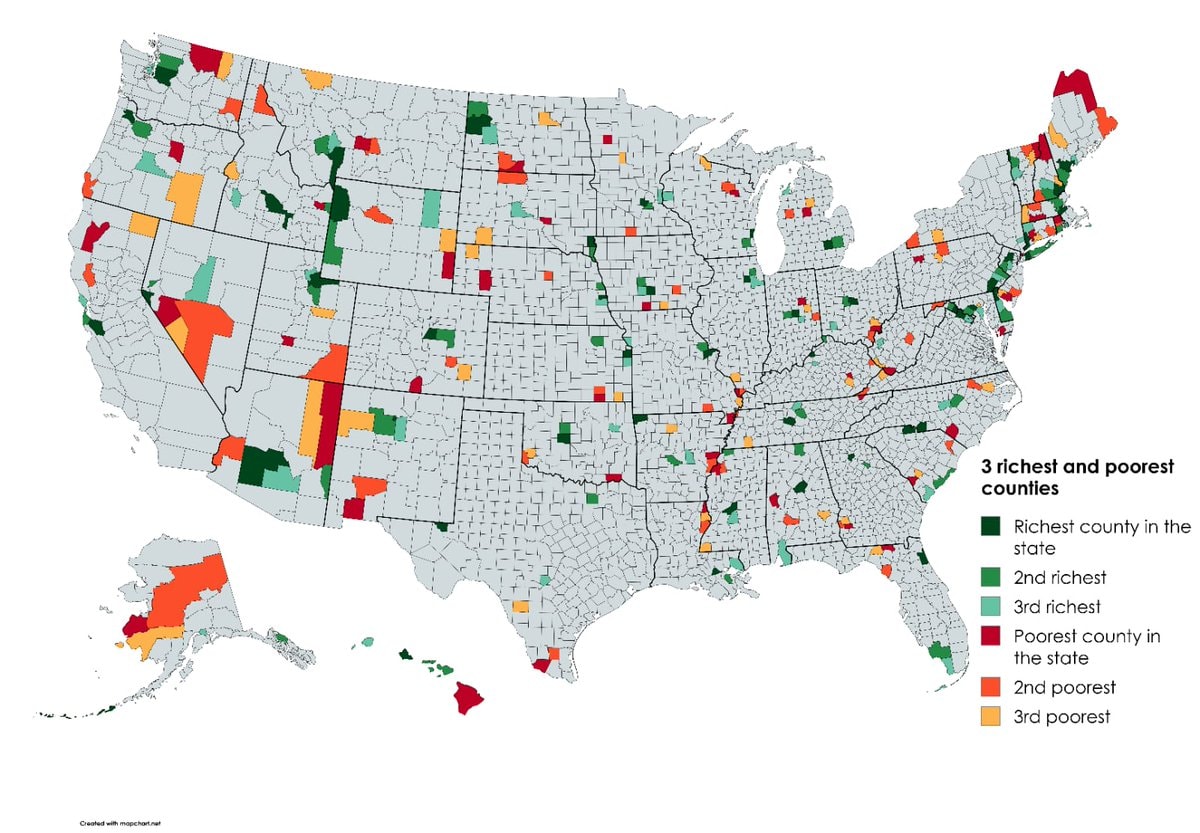 Richest and poorest US counties by state
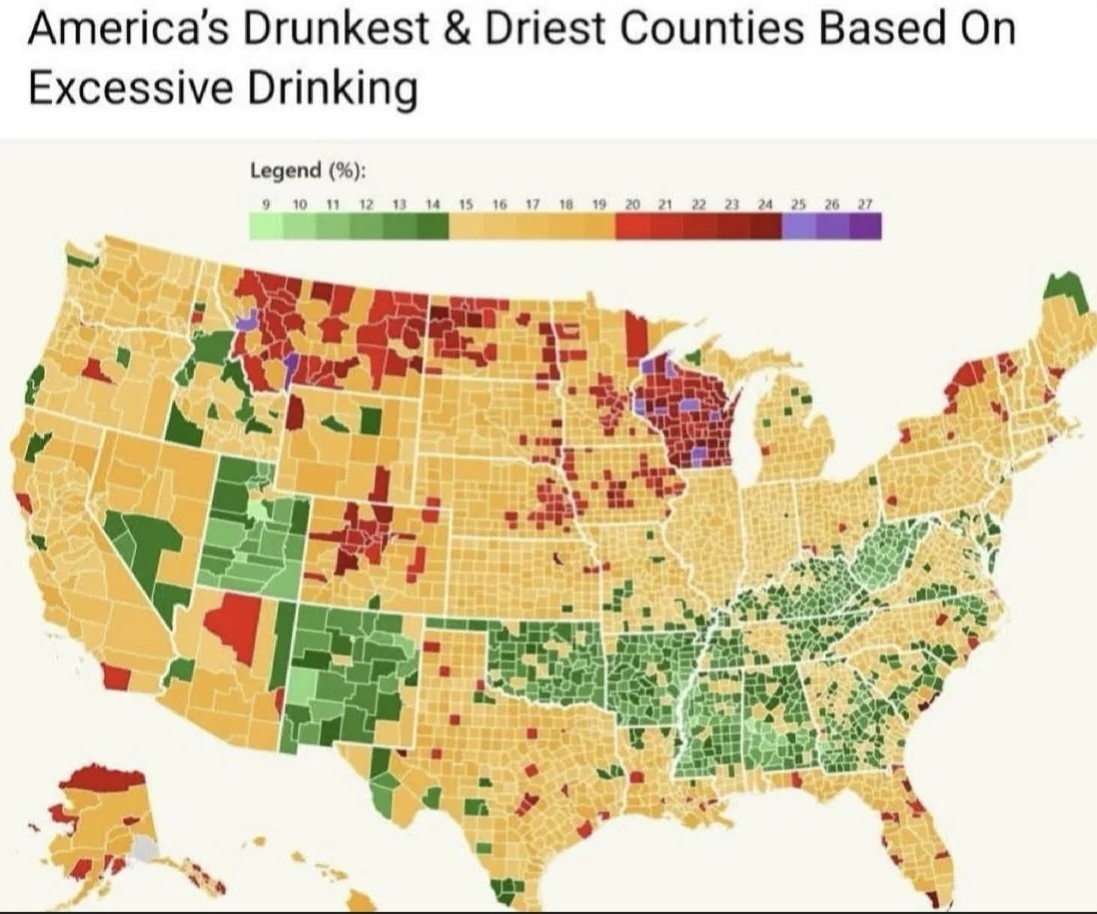 US counties excessive drinking map
 V-shaped lights over England speculation
 Josh Law Coast Guard rescue
 Trump administration election monitoring team
 2US funding to Israel ending
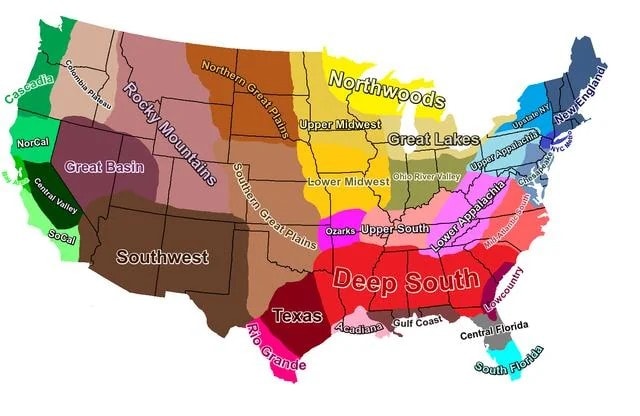 U.S. cultural regions map
@scarlett_sComparing Black population share across U.S. county data from 1900 against 2020
Vedi post originaleFoto di @scarlett_s· Oct 11, 2026· United States
The image displays two maps of the United States, one labeled "1900" and the other "2020". Both maps use varying shades of green to represent percentages of something, with a legend indicating categories from "Less than 2%" to "50+%". The maps show a significant concentration of darker green in the southeastern US in both years, though the pattern appears to have shifted slightly westward and thinned out in some areas by 2020. The overall mood is informative and data-driven, resembling a chart or infographic. Notable details include the total percentages displayed below each map: "Total: 11.6%" for 1900 and "Total: 12.4%" for 2020, along with the source "IPUMS NHGIS".
Brent crude oil chartUS tech stocks surge after Democratic victory2Democrats win US House and Senate2Abdul El-Sayed Michigan electionTectone blue waveNBC News graphic shows Democrats flipping Texas2US stock market gain after Democratic victory2US stock futures fall after electionDemocrats take House in US midtermsAbdul El-Sayed first Muslim senatorColumbia jacket I Voted stickerRichest and poorest US counties by stateUS counties excessive drinking mapV-shaped lights over England speculationJosh Law Coast Guard rescueTrump administration election monitoring team2US funding to Israel endingU.S. cultural regions map